One sample z test calculator
Welcome to our One Sample Z Test Calculator! This tool helps you perform a one-sample Z test for hypothesis testing quickly and accurately. our calculator simplifies the process of determining p-values, critical value, test statistics, decision and Conclusion.
Table of Contents
Understanding the One Sample Z Test
The one-sample Z test is used to assess whether there is a significant difference between the sample mean and the population mean. This test is appropriate when the population standard deviation is known and the sample size is large enough \( \mathrm{( n > 30)}\).
To determine if a population's mean is greater than, less than, or equal to a given value, use the one-sample z-test. This test is frequently referred to as the one-sample z-test since the critical values are determined using the standard normal distribution. The population standard deviation must be known in order to use the z-test.
How to Use the One Sample Z Test Calculator
- Select Data Type: Choose whether to input summary statistics directly or provide a data set.
- Input Your Data: Enter the necessary values such as the population mean, sample size, sample mean, and population standard deviation.
- Set Hypotheses: Specify the null and alternative hypotheses.
- Calculate: Click the "Calculate" button to see the test statistic, p-value, and other relevant results.
Example of one sample z test hypothesis
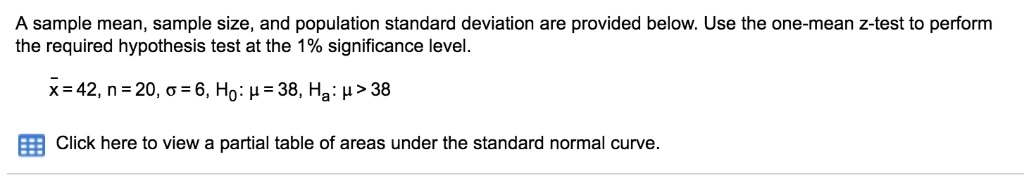
First lets find the given parameters
Sample size, \(n =20\), Sample mean, \(\bar x = 42\), Population standard deviation, \(\sigma = 6\), Population mean, \(\mu = 38\), Significance level, \(\alpha = 0.01\)
Solution :
The null and alternative hypothesis is
\(H_0: \mu = 38\) and \( H_a: \mu > 38 \)
The null hypothesis contains the equality sign and the alternative hypothesis contains the inequality sign.
Now, lets find the Test statistic which is required for find the p-value
Formula for the test statistic is
\( z = \frac{\bar{x}-\mu}{\frac{\sigma}{\sqrt{n}}} \)
Put the given values in above formula, we get
\(\frac{42-38}{\frac{6}{\sqrt{20}}} = 2.98 \)
The test statistic is 2.98
Here we round test statistic to two decimal places because this decimal places is used in p-value table to find the test statistic
Next, find the p-value to find the statistical decision
P-value :
The p-value with test statistic, z = 2.98 is
P( z > 2.98) = 0.0014
The p-value is 0.0014
The p-value in statistical hypothesis testing is the probability of obtaining results at least as extreme as the observed results of a statistical test, assuming that the null hypothesis is true.
The following Excel formula can be used to find the p-value:
=1-NORM.S.DIST(2.98,TRUE)
In this formula 2.98 is represents the test statistic.
Decision : Since the p-value is less than the chosen significance level, the decision is reject the null hypothesis.
Conclusion : There is sufficient evidence to conclude that population mean is greater than 38.
Since the decision is reject the null hypothesis, there is sufficient evidence to support alternative hypothesis.
Interpreting the Results
The results of the one-sample Z test will indicate whether you should reject the null hypothesis. A p-value smaller than α rejects the null hypothesis, showing a substantial difference between the sample and population means.
Applications of the One Sample Z Test
This test is widely used in various fields including:
- Education: Assessing whether the average test scores of a class differ from the national average.
- Healthcare: Comparing the mean blood pressure level of a group of patients to a known population mean.
- Business: Evaluating if the average sales of a product differ from the company's historical sales data.
Assumption for one sample z test :
The assumption for one sample z test are as follows
1. Continuous Data: It's true that continuous data is necessary. This indicates that rather than being discrete or categorical, the data points are measured on a continuous scale.
2. Simple Random Sample: According to this premise, there is no bias in the sample selection process and every individual in the population has an equal probability of being chosen. By doing this, the sample's representativeness to the population is increased.
3. Normality of Data: It is assumed that the data for a one-sample z-test have a normal distribution. This presumption is essential since the validity of the z-test depends on the characteristics of the normal distribution.
4. Known Population Standard Deviation: The z-test operates under the assumption that the population standard deviation (σ) is known, in contrast to the t-test, which necessitates the sample standard deviation.
Frequently Asked Questions (FAQs)
What is a one-sample Z test?
A one-sample Z test is a statistical test used to determine whether there is a significant difference between the mean of a sample and a known population mean.
When should I use a one-sample Z test?
You should use this test when the population standard deviation is known and the sample size is large (typically n > 30).
How do I interpret the p-value in a Z test?
The p-value indicates the probability of observing the test results under the null hypothesis. A low p-value (less than the significance level, α) suggests that you should reject the null hypothesis.
Why use our one-sample Z test calculator?
Our calculator offers several advantages:
- Accuracy: Provides precise calculations for your hypothesis testing needs.
- User-Friendly Interface: Easy to navigate and input your data.
- Educational Value: Offers detailed explanations and step-by-step guides to help you understand the results.
- Time-Saving: Quickly computes results, allowing you to focus on analysis and interpretation.
- Versatility: Suitable for various fields such as education, healthcare, and business, making it a valuable tool for a wide range of users.